How to Conduct a PHP Code Audit for Hidden Performance Killers
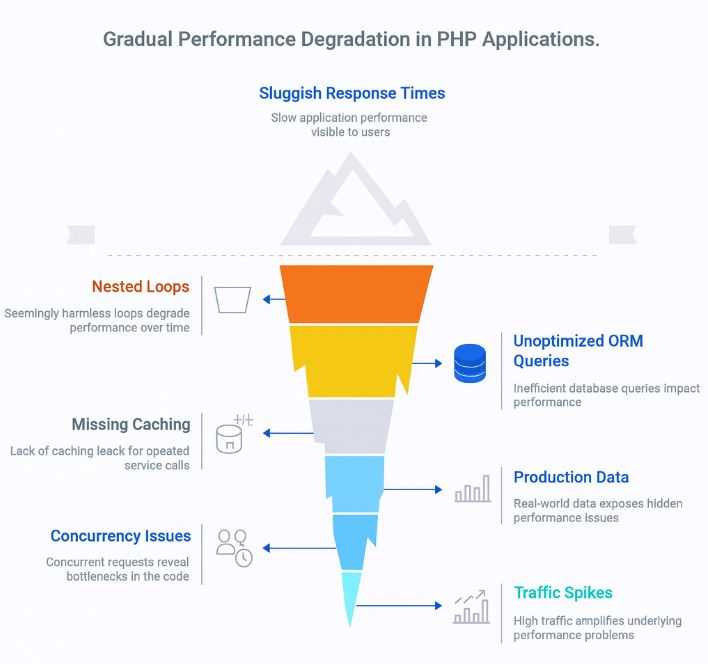
Most PHP applications don’t become slow because of one obvious bug. They degrade gradually. A nested loop that seemed harmless in the first release, an ORM query that was fine against 1,000 rows, a service call that never got cached, none of these alone bring down performance. But together, over months or years, they add up to sluggish response times, ballooning infrastructure costs, and frustrated users.
The real challenge is that these problems rarely show up in development or staging. They surface only under production data, real concurrency, and traffic spikes. By then, the fixes are harder, the complaints louder, and the pressure higher.
This guide is about auditing systematically: a repeatable process to uncover hidden performance killers, fix them with precision, and keep them from creeping back in.
Why Audit Your PHP Codebase?
You need to audit your PHP codebase if you want to maintain your application’s performance. For example, a query that used to return instantly now drags against a database that’s ballooned in size. Or perhaps an ORM call that seemed fine in staging suddenly spawns hundreds of pointless fetches in production. By the time these issues surface as user complaints or spiking infrastructure bills, the root cause is already buried.
A proper PHP performance audit is about bringing those causes into the open. It’s not a rewrite, not a quick optimization sprint, and not just another code review. Those activities focus on what’s visible to the team. An audit goes deeper. It examines execution time, memory behavior, CPU load, database queries, and I/O under real traffic. It draws on both continuous telemetry and targeted profiling to paint a picture of how the application really behaves when users are pushing it.
Profilers like Blackfire or Tideways have their place, but they are diagnostic tools, snapshots that highlight hotspots in a given execution path. What they don’t give you is the ongoing perspective of Application Performance Monitoring. That’s where APM and modern observability stacks (New Relic, Datadog, OpenTelemetry) matter. They connect symptoms, an unexplained AWS cost spike, a drop in request throughput, a surge in error rates, directly back to the code paths causing them. Without that connection, teams are left guessing.
Most teams don’t order an audit until their velocity has already tanked. A better approach is to treat audits like routine maintenance: a recurring check that keeps costs under control and systems stable. When you make audits part of your development culture, you stop playing catch-up. You start preventing the hidden inefficiencies that silently erode your product’s future.
Step 1 – Establish a Baseline
The first step in any PHP performance audit is to capture how your application behaves today. Without hard numbers, you have no way to judge whether changes improve or degrade performance. The baseline is a set of repeatable benchmarks gathered under conditions that resemble production as closely as possible.
Not every metric comes from profiling alone. Some performance goals are set by business needs such as checkout time, report generation speed, API SLA, or user-facing response time. Defining those up front aligns the audit with what actually matters to customers and stakeholders.
Start by measuring core metrics:
- Response time: Track median and 95th/99th percentile latencies for critical endpoints.
- Memory usage: Use
memory_get_usage()in targeted areas, and run long-lived workers under load to spot creeping leaks. - Database query count and cost: Laravel Telescope or Doctrine profilers will expose redundant queries, while
EXPLAINplans reveal whether indexes are actually used. - Throughput: Requests per second under load, which gives you a capacity ceiling.
For diagnostic tooling, pair profilers with visualizers. Blackfire and Tideways provide detailed call graphs and wall-time breakdowns across functions. Xdebug combined with QCacheGrind offers lower-level insight, especially for spotting expensive recursion or over-allocated objects. In Laravel applications, Telescope can surface query and request metrics during development, but don’t mistake it for a full profiler, it’s supplementary.
Numbers alone aren’t enough if they’re captured in artificial conditions. Introduce synthetic load with tools like k6 or Artillery to simulate traffic patterns. Reproduce typical user flows, not just the homepage, and capture metrics at scale. Run the same scenarios repeatedly so you can compare results after each optimization.
Finally, connect profiling to your CI/CD pipeline. Even a lightweight Blackfire Player script or a GitHub Action that checks response-time thresholds can flag performance regressions automatically. This turns your baseline into a living benchmark, something teams compare against during continuous development rather than a one-off optimisation exercise.
Step 2 – Identify Hotspots
With your baseline in place, you can now move from measurement to diagnosis. The goal in this step isn’t to optimise prematurely, but to locate where the most significant slowdowns occur under real workloads. Hotspots rarely reveal themselves; they tend to hide inside loops, ORM abstractions, or long-running workers, and a focused audit is what brings them to light.
Detect Slow Application Logic
Tools like Blackfire and Tideways make it obvious which functions are eating up wall time. Look for stack traces where a single call explodes into thousands of invocations. Even a single line of inefficient code can have a significant impact on performance. Usual suspects include:
- Nested loops that grow worse as data size increases
- Heavy array operations that burn through memory or CPU
- Long chains of functions (like multiple string transforms in tight loops)
When reading profiler output, don’t just look at execution time, call counts matter just as much. A function that runs in microseconds can still choke a request if it fires 10,000 times. In Laravel, Telescope adds extra visibility by flagging slow requests and query-heavy endpoints.
Audit Database Queries
Databases are often the primary choke point. Use EXPLAIN to verify index usage and query plans. In ORM-driven apps, look for N+1 query patterns where a single collection fetch spawns dozens of additional queries. Laravel Debugbar or the Doctrine profiler are effective at exposing these.
A critical distinction: issues that don’t appear in local development often explode against production-scale data. A join that returns 50 rows in staging may return 50,000 in production.
Investigate Memory and Resource Leaks
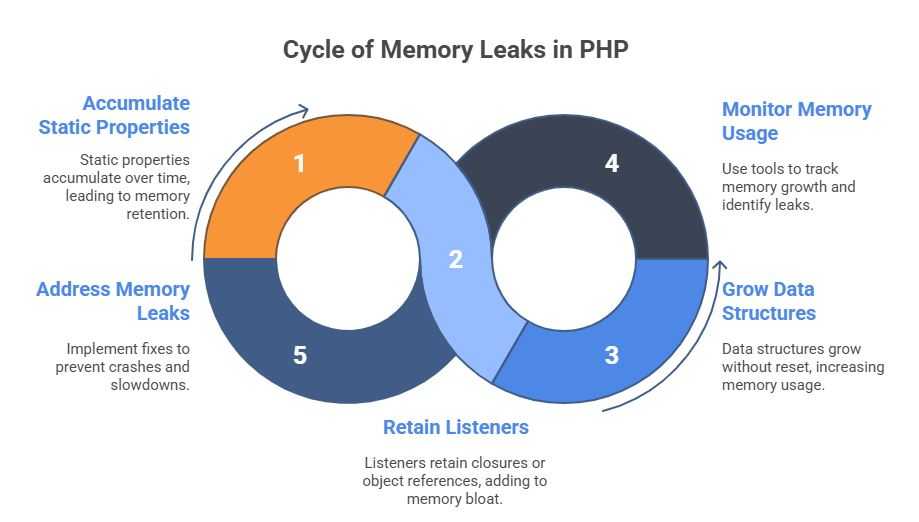
Static properties live for the lifetime of the process. If you stash an object there and forget about it, PHP’s garbage collector won’t clean it up in long-running contexts such as Octane, RoadRunner, FrankenPHP, or custom daemons. That stale reference sticks around, keeping memory tied up long after it’s needed. Over time, these “forgotten” objects can quietly balloon into leaks.
This issue was less visible in traditional PHP setups (Apache or PHP-FPM) because each request created a new process and released memory afterward. With modern persistent worker models, memory leaks are more common since the same process handles multiple requests over time.
Listeners often capture closures or object references. If they’re registered globally and never unbound, they stay in memory for every request that process handles. Each new listener adds more retained state, even if the code it points to is never called again. In high-throughput systems, this turns into creeping memory bloat.
With long-running PHP (Octane, RoadRunner, daemons), data structures don’t reset like they would in traditional request/response lifecycles. If you push items into an array or collection and don’t clear it, the structure just keeps growing. Memory usage then scales with uptime and traffic and eventually tips the process into slowdown or crashes.
Use tools like memory_get_usage() or Tideways’ memory snapshots to track leaks. Don’t just watch overall usage, look for code paths where memory grows with traffic or time. If you ignore it, the process won’t just slow down, it’ll eventually crash.
Step 3 – Refactor the Right Things
An audit will always reveal more issues than you can fix at once. The hard part is not finding bottlenecks, it’s knowing which ones to attack first. The guiding principle is performance gain relative to effort. A single N+1 query that affects 80% of requests is worth addressing immediately; an inefficient loop buried in an infrequently used admin panel can wait. Prioritization prevents audits from becoming endless refactoring sprints.
Focus on Proven Hotspots
Premature optimization wastes time and often introduces new complexity. Use stack traces, APM traces, and query metrics to validate that a candidate hotspot is truly dragging performance.
Typical Wins
- Refactor tight loops: Replace nested iterations over large datasets with indexed lookups or pre-filtered queries.
- Reduce object churn: Excessive object creation in high-traffic code paths increases CPU and memory usage. Consider lightweight data structures for hot code.
- Eliminate repeated queries: Cache results of invariant lookups (e.g., config tables, permissions) using Laravel Cache, Redis, or simple memoization inside a request lifecycle.
Here are some examples.
Before (Inefficient ORM with nested calls)
// Fetch 1000 users and then hit DB again for each order set
$users = User::where('active', true)->get();

foreach ($users as $user) {
    $latestOrder = $user->orders()
        ->where('status', 'paid')
        ->latest()
        ->first();  // 1000+ queries
}
After (Optimized eager loading with constraints):
$users = User::where('active', true)
    ->with(['orders' => function ($query) {
        $query->where('status', 'paid')->latest()->limit(1);
    }])
    ->get();

foreach ($users as $user) {
    $latestOrder = $user->orders->first(); // One query per batch
}
This collapses thousands of queries into a single batched query with scoped eager loading.
Optimize Hot Loops with Pre-Computation
Before:
foreach ($products as $product) {
    $categoryName = Category::find($product->category_id)->name;
    logProduct($product->id, $categoryName);
}
After:
$categories = Category::whereIn('id', $products->pluck('category_id'))
    ->pluck('name', 'id');

foreach ($products as $product) {
    $categoryName = $categories[$product->category_id] ?? null;
    logProduct($product->id, $categoryName);
}
Instead of hitting the DB per iteration, you hydrate the lookup once and work in memory.
Reduce Object Churn & Memory Leaks
Before (long-lived worker leaking memory):
class EventHandler {
    protected static $cache = [];

    public function handle($event) {
        self::$cache[] = $event->payload; // grows forever
    }
}
After (release memory each cycle):
class EventHandler {
    public function handle($event) {
        $payload = $event->payload;
        process($payload); // handle and release automatically
    }
}
In most PHP applications, memory is reclaimed automatically at the end of each request. Problems appear only in long-running workers, such as Octane, RoadRunner, or queue daemons, where the process stays alive and static references persist across cycles.
In the example above, the issue isn’t the $payload variable but the static $cache, which never resets. Removing static or global caches between iterations prevents retained objects from accumulating silently over time
Cache Expensive Computations
Before:
public function getExchangeRate($currency) {
    return Http::get("https://api.exchangerates.io/latest?base={$currency}")
        ->json()['rate'];
}
After:
public function getExchangeRate($currency) {
    return Cache::remember("exchange:{$currency}", now()->addMinutes(30), function () use ($currency) {
        return Http::get("https://api.exchangerates.io/latest?base={$currency}")
            ->json()['rate'];
    });
}
Each of these refactors addresses a real bottleneck class: query explosions, tight loop inefficiency, memory misuse in long-running workers, and unnecessary I/O. These aren’t theoretical improvements, they’re the kinds of changes that move infrastructure cost and user experience metrics in measurable ways.
Step 4 – Lock in Gains with Regression Testing
Refactoring without regression testing is a waste of effort. If you don’t enforce performance budgets, every optimization you ship will be undone the next time someone merges a “small change” that reintroduces an N+1 query or an unbounded loop. Treat performance like test coverage or CI builds, failing the pipeline if it regresses. Anything less is negligence.
Start with performance-aware PHPUnit tests, but don’t settle for crude microtime checks. Build assertions around real workloads and enforce query budgets:
public function testOrdersEndpointPerformance(): void
{
    DB::enableQueryLog();
    $this->getJson('/api/orders?limit=100')
        ->assertOk()
        ->assertJsonCount(100, 'data');

    $queryCount = count(DB::getQueryLog());
    $this->assertLessThan(
        5, $queryCount, "Expected <5 queries, got {$queryCount}"
    );
}
This test fails if someone sneaks an N+1 into a hot path. That’s far more actionable than timing alone.
Then harden the pipeline. Blackfire Player or Tideways CI hooks should run scripted scenarios against each pull request and fail the build if wall time, memory usage, or query count exceeds baseline thresholds. Don’t leave this to manual review, developers are bad at noticing performance regressions when focused on features.
Finally, raise the bar on code review. A reviewer who waves through a PR with ->each()->map()->filter() inside a request handler should be called out. Performance regressions aren’t “later problems.” They’re bugs, and they should block merges.
Teams that don’t institutionalize regression testing end up firefighting the same problems on repeat. The ones that do build velocity, because they know optimizations today won’t be quietly undone tomorrow.
Step 5 – Make Auditing a Recurring Process
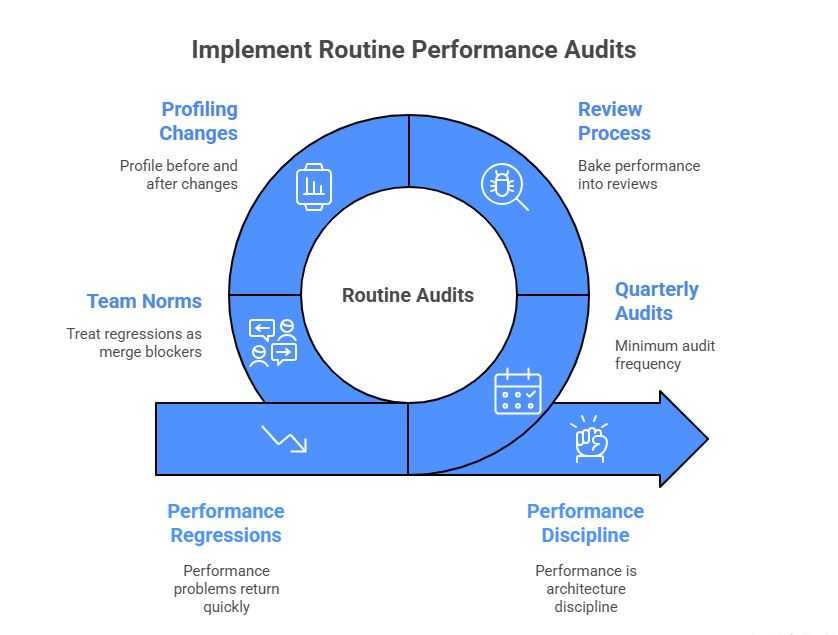
One-off audits are better than nothing, but they don’t change how a team ships software. Performance problems return the moment velocity picks up and shortcuts creep back in. The only way to stay ahead is to make auditing routine, as regular as code review or release planning.
The cadence depends on your risk profile, but quarterly audits are a minimum. High-traffic systems should add lightweight audits after major feature launches. This ensures new endpoints, migrations, or service integrations don’t undo previous gains.
Bake performance into your review process. Code reviewers should not only do a security audit and check for correctness, but also for query counts, unbounded loops, and unnecessary object churn. Simple checklist items, “Did we profile this endpoint?” or “What’s the expected query count?”, force developers to think about runtime impact, not just business logic.
Team norms matter as much as tooling. Encourage engineers to run profiling before and after changes and to treat regressions as merge blockers, not “something ops will fix later.” Over time, this creates a culture where developers see performance not as polish, but as core functionality.
At Accesto, we frame it this way: performance is architecture discipline. Making audits recurring locks that discipline into the way your product evolves, ensuring it scales with both users and features.
What to Do When the Audit Uncovers More Than You Can Fix
The uncomfortable truth is that most audits surface more problems than a team can realistically fix in one go. It’s not uncommon to find a mix of ORM inefficiencies, hidden memory leaks, and architectural coupling that go well beyond the scope of “a few quick refactors.” That’s normal. The key is not to panic, it’s to decide what’s worth fixing now and what can safely wait.
Start with triage and prioritization. If a single N+1 query accounts for 80% of database load, that deserves attention immediately. If an admin-only feature still uses an unindexed table from 2015, it can be deferred. Low-impact areas can be isolated or flagged for future refactoring rather than blocking current delivery. The most effective remediation plans map high-impact fixes into upcoming sprints or feature work, so performance improvements land without derailing roadmaps.
At some point, internal capacity becomes the real constraint. You may have the audit results but not the time, or the expertise, to tackle deeper structural risks. If touching legacy code consistently drags down velocity, or if you’re stuck applying the same hotfixes to symptoms, it’s a sign the team has hit a wall.
This is where outside specialists help. Post-assessment, external auditors can step in to surgically resolve high-impact issues, the kind that require niche expertise in PHP internals, query tuning, or architectural decoupling. At Accesto, we work with teams who want to modernize incrementally: no massive rewrites, no downtime, just a series of focused interventions that keep systems stable while removing the performance debt that holds them back.
The Cost of Waiting vs. the Value of Auditing
Performance debt in PHP doesn’t arrive in one dramatic collapse. It slips in quietly through everyday decisions, an unbounded loop left in place because it “wasn’t a problem yet,” a query written for a dataset that was small at the time, an API call that gets reused without caching. None of these issues look urgent in isolation. Together, they compound until the system feels sluggish, infrastructure costs balloon, or users simply stop waiting for pages to load.
The mistake most teams make is assuming performance can be handled reactively. Waiting until the slowdown is obvious is expensive, by then, engineering velocity has already dropped, cloud bills are higher than they should be, and the fixes are harder to isolate. The value of auditing is that it lets you intervene before those costs spiral. Profiling and structured audits reveal bottlenecks that can be fixed with targeted refactors, not rewrites. They also create the benchmarks that prevent regressions from creeping back in.
Just as you wouldn’t ship without automated tests, you shouldn’t scale without repeatable performance audits. They’re a safeguard that grows with the application, and a discipline that keeps architecture honest.
If your audit uncovers more than your team can handle alone, that’s where external expertise comes in. At Accesto, we’ve built our practice around helping PHP teams surface and resolve the kinds of issues that don’t just hurt performance, they hold back entire products. Sometimes the smartest move isn’t waiting, it’s asking for sharper eyes. Connect with us today to see how we can help you.
